Greenpeace Energy 3.0
Greenpeace Enery 3.0
  • HOME
  • APPROACHES
    • Rapid response and intelligence
    • Integration and electrification
    • Meeting the demand for heating
    • Co-generation and solar thermal energy
    • Scenarios
    • Climate
    • Economic growth and population
  • BUILDING
    • Urbanised land scenario
    • Modal distribution
    • Energy consumption components
    • Energy consumption in residential buildings
    • Energy consumption in service-sector buildings
    • Total consumption scenarios
    • Transition scenarios
  • TRANSPORT
    • Mobility
    • Modal distribution
    • Consumption per mode of transport
    • Energy consumption of traveller transport
    • Energy consumption of freight transport
    • Total consumption scenarios
    • Transition scenarios
  • TOTAL ENERGY DEMAND
    • Industry
    • Other sectors
    • Emission scenarios
  • COST SCENARIOS
    • Renewables
    • Emissions
    • Fossil fuels and nuclear energy
    • Hydrogen
    • Other resources
    • Fossil and nuclear electricity
    • Cost of saving
  • DEMAND COVERAGE SCENARIOS
    • Temporal variation in demand
    • BAU demand Scenario with BAU coverage
    • BAU demand Scenario with 100% renewable coverage
    • Efficiency demand Scenario with 100% renewable coverage
    • Efficiency demand Scenario plus demand-side management
    • Cost scenarios
    • Land occupation
  • CONCLUSIONS AND DOWNLOADS
    • Greenpeace proposals
    • Downloads
You are in: Cost scenarios / Fossil and nuclear electricity costs
5.6

FOSSIL AND NUCLEAR

ELECTRICITY COSTS

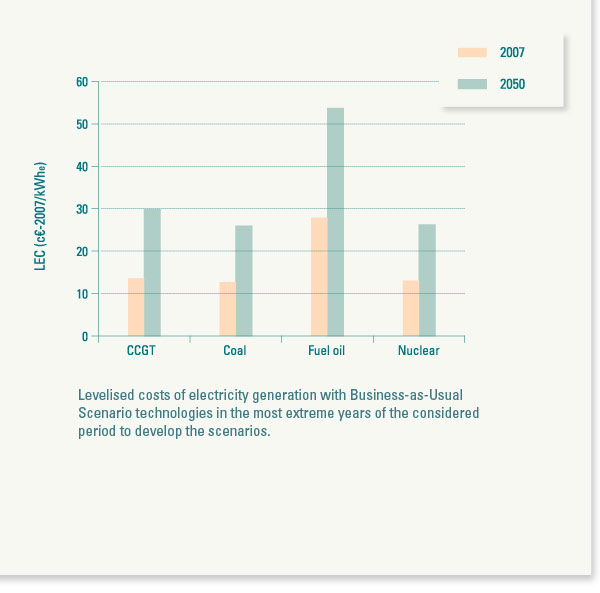
This scenario compiles the levelised costs of electricity for the BAU Scenario. These costs include fuel, operation and maintenance cost scenarios as well as the corresponding incremental inflation rates. Costs have been levelised using a money interest of 8% and a general inflation rate of 3.5% per annum, as well as a 30-year useful life for natural gas installations and natural gas combined cycle power plants (CCGT), 35 years for coal plants and 40 years for the potential new nuclear power stations.


If the different capacity factors are taken into account, the graph shows the levelised total costs (including the costs of CO2 emissions) associated with electricity generation through the mix of technologies of the BAU Scenario.


    Ampliar Imagen


© Greenpeace 2011

Design and development: Sayhello.es