Greenpeace Energy 3.0
Greenpeace Enery 3.0
  • HOME
  • APPROACHES
    • Rapid response and intelligence
    • Integration and electrification
    • Meeting the demand for heating
    • Co-generation and solar thermal energy
    • Scenarios
    • Climate
    • Economic growth and population
  • BUILDING
    • Urbanised land scenario
    • Modal distribution
    • Energy consumption components
    • Energy consumption in residential buildings
    • Energy consumption in service-sector buildings
    • Total consumption scenarios
    • Transition scenarios
  • TRANSPORT
    • Mobility
    • Modal distribution
    • Consumption per mode of transport
    • Energy consumption of traveller transport
    • Energy consumption of freight transport
    • Total consumption scenarios
    • Transition scenarios
  • TOTAL ENERGY DEMAND
    • Industry
    • Other sectors
    • Emission scenarios
  • COST SCENARIOS
    • Renewables
    • Emissions
    • Fossil fuels and nuclear energy
    • Hydrogen
    • Other resources
    • Fossil and nuclear electricity
    • Cost of saving
  • DEMAND COVERAGE SCENARIOS
    • Temporal variation in demand
    • BAU demand Scenario with BAU coverage
    • BAU demand Scenario with 100% renewable coverage
    • Efficiency demand Scenario with 100% renewable coverage
    • Efficiency demand Scenario plus demand-side management
    • Cost scenarios
    • Land occupation
  • CONCLUSIONS AND DOWNLOADS
    • Greenpeace proposals
    • Downloads
You are in: Cost scenarios / Costs of emissions
5.2
COSTS OF EMISSIONS

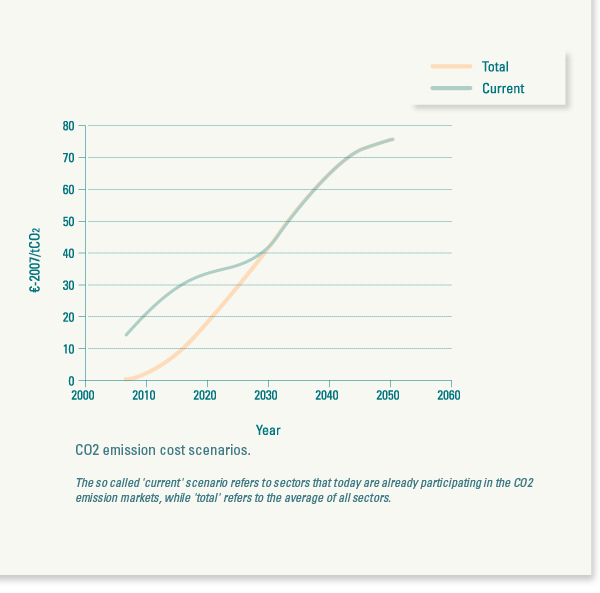
The adopted CO2 price scenarios have been elaborated bearing in mind three factors:


* Costs will tend to increase over time, as the requirements on emissions reduction became more stringent.


* All sectors responsible for emissions must join the emissions trading or incorporate other mechanisms (fees or taxes) to pay for the emitted CO2.


* CO2 prices in the market are expected to be below the costs of internalising the real impact of CO2 emissions.


    Ampliar Imagen


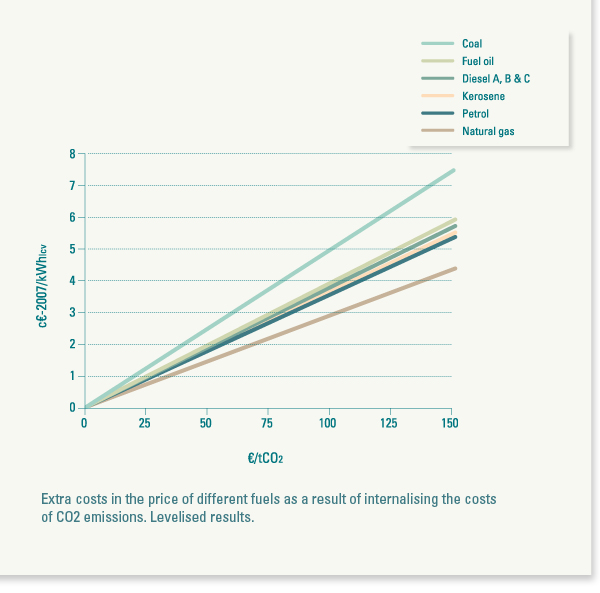
    The figure shows the effect of the CO2 price on the extra cost of different fuels, levelised over a period of 30 years.


    Ampliar Imagen


© Greenpeace 2011

Design and development: Sayhello.es